
Abstract
The Centers for Disease Control and Prevention (CDC) asserts that more than 42 million Americans are currently infected with disease‑associated human papillomavirus (HPV) types, with approximately 13 million new infections occurring annually. These figures are presented as evidence of a widespread, persistent threat, justifying aggressive vaccination campaigns. However, such claims are not based on direct testing data but on presumptions that conflate transient viral DNA detection with clinically significant disease. Rigorous biological analysis demonstrates that over 95% of HPV infections, including high‑risk oncogenic types such as HPV‑16 and HPV‑18, clear spontaneously within two years in immunocompetent individuals. Only a small minority persist long enough to progress through the multi‑decade sequence of cervical intraepithelial neoplasia grade 3 (CIN3), adenocarcinoma in situ (AIS), and invasive cervical cancer.
Cross‑referencing CDC prevalence claims with Surveillance, Epidemiology, and End Results (SEER) program data reveals a sustained decline in cervical cancer incidence and mortality in the United States since the mid‑1970s, driven by natural immunity, Pap screening, and treatment of precancers—not HPV vaccination. If the CDC’s backlog of 42 million infections and 13 million new annual cases represented persistent oncogenic disease, the U.S. would face hundreds of thousands of cervical cancers annually, a scenario contradicted by observed epidemiology (~13,490 cases and ~2,100 deaths yearly). This article integrates stage‑specific progression tables, case studies, and treatment outcomes to demonstrate that the CDC’s framing is scientifically unsound. The conclusion is clear: the CDC’s infection counts are rhetorical inflation, not epidemiological reality.
Introduction
HPV is a ubiquitous virus, but ubiquity does not equate to inevitability of disease. The CDC’s claim of 42 million current infections and 13 million new infections annually positions HPV as a near‑universal, persistent threat. Yet, these figures reflect transient viral DNA detection rather than clinically significant persistence. More than 95% of infections resolve naturally, and only a small minority progress to CIN3 and beyond.
Historical and contemporary epidemiological data confirm this disconnect. Cervical cancer incidence has declined by more than 50% since the mid‑1970s, despite population growth. Mortality has dropped to 2.2 per 100,000 women in 2022. These declines occurred before and independent of HPV vaccination, introduced in 2006. The biological impossibility of the CDC’s backlog claim becomes evident when progression timelines are considered: infection to CIN3 takes 5–20 years, and CIN3 to cancer takes 3–15 years untreated. If tens of millions of persistent infections existed, the U.S. would face catastrophic cancer rates, which is not observed.
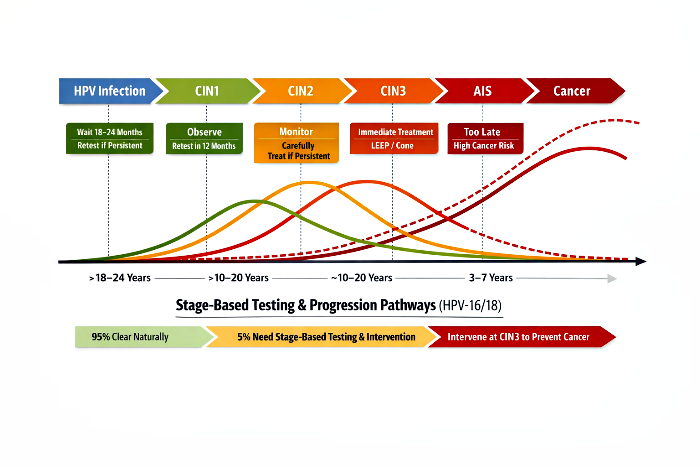
Natural History, Progression, And Treatment Outcomes
Understanding the natural history of HPV‑16/18 infections is essential before evaluating claims of widespread persistent disease. The majority of infections, even those caused by high‑risk oncogenic strains, are transient and clear spontaneously within one to two years in immunocompetent individuals. Only a small minority persist, and among these, progression to precancerous lesions such as CIN2/3 and eventually invasive cancer takes place over decades. This slow trajectory underscores that infection alone does not equate to disease, and that immune strength plays a decisive role in determining whether HPV remains clinically insignificant or evolves into a serious condition.
Treatment outcomes further highlight the importance of immune status and stage of detection. While early lesions (CIN1 and CIN2) often regress naturally, CIN3 represents the true intervention point where treatment is both necessary and effective. At this stage, procedures such as LEEP or conization can prevent progression to AIS and invasive cancer. However, recurrence risks vary: slow progressors benefit most, with recurrences occurring outside the natural AIS→Cancer window, while fast progressors and immunocompromised individuals face higher recurrence rates within the natural progression timeline. These dynamics make clear that stage‑based testing and intervention, rather than indiscriminate screening or inflated infection counts, provide the most rational and scientifically grounded approach to HPV management.
Table 1: Consolidated Natural History, Progression, And Clinical Timelines (HPV‑16/18, Base Year: 2010)
| Immune Category | Clearance / Persistence | CIN 2/3 Appearance | CIN 2/3 Duration | Invasive Cancer Timeline (No Treatment) | Time: Infection → AIS | Time: AIS → Cancer (No Treatment) | Screening at AIS Stage | Treatment at AIS Stage | Cancer Cases Despite Treatment (% of AIS) | Notes on Recurrence |
|---|---|---|---|---|---|---|---|---|---|---|
| Normal Immune System | >90% clear within 1–2 years | None | N/A | None | N/A | N/A | Not applicable | Not applicable | 0% | Infection transient, clinically insignificant |
| Weak Immune System (Slow Progressors) | Partial control; high persistence | 10–15 Years | 10–15 Years | 25–30 Years | ~25 Years → 2035 | ~5 Years → 2040 | Detectable at AIS (LEEP/cone usually curative) | High success; most cured | ~5–10% | Recurrence usually occurs after 2040, outside AIS→Cancer window |
| Very Weak Immune System (Fast Progressors) | Poor control; rapid persistence | 5–10 Years | ~5 Years | 10–15 Years | ~15 Years → 2025 | ~5 Years → 2030 | Detectable at AIS (requires aggressive excision) | Moderate success; higher recurrence risk | ~15–20% | Recurrence can occur within or just beyond 2030, limiting benefit |
| Immune‑Compromised (HIV / Severe Suppression) | Accelerated persistence | 3–5 Years | <2 Years | 5–10 Years | ~7 Years → 2017 | ~3 Years → 2020 | Detectable at AIS (needs strict monitoring) | Lower success; hysterectomy often required | ~25–30% | Recurrence often rapid, sometimes within AIS→Cancer window |
Analysis:
This table highlights how immune strength dictates HPV‑16/18 progression. In normal immune systems, infections are transient and clinically insignificant. Weak immune systems show persistence, with CIN2/3 appearing after a decade and cancer risk emerging only after 25–30 years. Fast progressors and immunocompromised individuals face much shorter timelines, with CIN2/3 appearing within 5–10 years and invasive cancer within 10–15 years. Treatment outcomes vary: slow progressors respond well, while fast progressors and immunocompromised patients face higher recurrence risks, often within the natural AIS→Cancer window.
Table 2: Treatment Reset Timelines (HPV‑16/18)
| Immune Category | Natural AIS→Cancer Window | Recurrence Timeline After Treatment | Interpretation |
|---|---|---|---|
| Weak (Slow Progressors) | 2035 → 2040 | 2045–2050 or later | Treatment resets the clock; failures are technical/medical, not immune system based/biological. |
| Very Weak (Fast Progressors) | 2025 → 2030 | 2030–2035 | Treatment buys time but recurrence may still occur within or just beyond the natural window. |
| Immunocompromised | 2017 → 2020 | 2020–2023 | Treatment does not reset the clock; recurrence is rapid and often within the natural window. |
Analysis:
This table shows how treatment interacts with natural progression. For slow progressors, treatment is highly effective, essentially resetting the biological clock and delaying recurrence for decades. Fast progressors benefit less, as recurrence often occurs within or just beyond the natural AIS→Cancer window. Immunocompromised patients gain the least benefit, with recurrence rapid and often within the natural window, underscoring the limited durability of treatment in this group.
Table 3: CIN3 Progression Timelines (HPV‑16/18, Base Year: 2010)
| Immune Category | Time: Infection → CIN3 | Time: CIN3 → AIS | Notes on Progression |
|---|---|---|---|
| Weak Immune System (Slow Progressors) | ~20 Years → 2030 | ~5 Years → 2035 | CIN3 appears around 2030; if untreated, progresses to AIS by 2035. Treatment at CIN3 stage is often curative, with high regression potential. |
| Very Weak Immune System (Fast Progressors) | ~10 Years → 2020 | ~5 Years → 2025 | CIN3 appears much earlier, around 2020; progresses to AIS by 2025. Treatment at CIN3 stage reduces risk but recurrence can occur within the natural window. |
| Immune‑Compromised (HIV / Severe Suppression) | ~5 Years → 2015 | ~2 Years → 2017 | CIN3 appears rapidly, by 2015; progresses to AIS by 2017. Treatment at CIN3 stage is less effective, recurrence is frequent and aggressive. |
Analysis:
CIN3 is the last reliable intervention point before AIS. Slow progressors reach CIN3 after about 20 years, offering a long detection window and high regression potential if treated. Fast progressors reach CIN3 within 10 years, and immunocompromised patients within 5 years, both progressing quickly to AIS. Treatment at CIN3 is less effective in these groups, with frequent recurrence. This emphasizes the need for earlier and more frequent screening in high‑risk populations.
Table 4: Case Study – Ideal CIN3 Testing Timeline For A Girl Aged 13 In 2010 (HPV‑16/18)
| Immune Category | Natural CIN3 Onset (Base Year 2010) | Biologically Impossible Before | Ideal Testing Window for CIN3 | Rationale |
|---|---|---|---|---|
| Normal Immune System | No CIN3 (infection clears) | CIN3 progression biologically impossible | Not applicable | >90% clearance; transient infection. |
| Weak Immune System (Slow Progressors) | ~2030 (she is 33 years old) | Before ~2025 (age 28) biologically impossible | 2028–2030 | CIN3 appears only after ~20 years; testing just before onset ensures detection. |
| Very Weak Immune System (Fast Progressors) | ~2020 (she is 23 years old) | Before ~2018 (age 21) biologically impossible | 2018–2020 | CIN3 onset ~10 years post‑infection; testing captures early progression. |
| Immunocompromised (HIV / Severe Suppression) | ~2015 (she is 18 years old) | Before ~2014 (age 17) biologically impossible | 2014–2015 | CIN3 onset ~5 years post‑infection; testing must occur very early. |
Analysis:
This case study translates the general timelines of HPV‑16/18 progression into a practical scenario, showing how immune strength and age interact to determine when CIN3 becomes biologically possible. For individuals with normal immune systems, CIN3 never develops, making testing unnecessary. In contrast, slow progressors reach CIN3 only after about 20 years, meaning the earliest biologically possible onset is around age 28, with the ideal testing window between ages 28–30. Fast progressors and immunocompromised individuals face much shorter timelines, with CIN3 appearing by ages 23 and 18 respectively, requiring testing windows as early as 17–20 years of age.
The critical clarification here is that testing before the biologically possible onset is futile and risks overdiagnosis. Table 4 emphasizes that CIN3 cannot appear before certain ages depending on immune strength, so premature screening would only detect transient infections. By aligning testing windows with biological reality, the case study ensures that screening is both efficient and meaningful. This avoids unnecessary interventions in those who will clear the infection naturally, while still capturing progression in the small subset at risk.
Table 5: Stage‑Based Testing Strategy (HPV‑16/18)
| Stage | Natural Course | Risk of Over‑Testing | Safe Testing / Intervention Window | Rationale |
|---|---|---|---|---|
| Initial Infection (HPV DNA+, no lesions) | ≈95% clear within 1–2 years | Very high – most infections resolve naturally | Retest only if infection persists beyond 18–24 months | Early testing causes anxiety and overtreatment; persistence beyond 2 years signals risk group (≈5%). |
| CIN1 (low‑grade changes) | 90% of persistent cases regress | High – regression is common | Repeat cytology/HPV testing in 12 months | Observation preferred; aggressive treatment unnecessary at this stage. |
| CIN2 (moderate changes) | Some regress, some progress | Moderate – depends on age and persistence | Monitor closely; treat if persistent (esp. in older women) | Balances regression potential with risk of progression; individualized approach. |
| CIN3 (high‑grade changes) | Precancerous, unlikely to regress | Low – intervention justified | Immediate treatment (LEEP, conization) | True intervention point; prevents progression to AIS and invasive cancer. |
| AIS → Cancer | Rapid progression once AIS develops | N/A – testing too late | Prevention relies on CIN3 detection | Detecting CIN3 early avoids reaching AIS/cancer stage. |
Analysis:
This table outlines a general clinical framework for stage‑based testing, focusing on minimizing overtreatment while ensuring timely intervention. At the initial infection stage, most cases clear naturally within two years, so retesting is only warranted if persistence lasts beyond 18–24 months. CIN1 and CIN2 are transitional stages where regression is common, especially in younger women, making observation and repeat testing the safest approach. CIN3, however, represents the decisive intervention point, as lesions are precancerous and unlikely to regress. Immediate treatment at this stage prevents progression to AIS and invasive cancer.
The clarification here is that Table 5 provides broad rules applicable to all populations, while Table 4 contextualizes these rules with age‑specific timelines. Together, they eliminate ambiguity: testing should not occur prematurely at the infection or CIN1 stage, but should be timed to capture CIN3 onset, which varies by immune strength. This ensures that resources are directed toward the 5% of persistent cases, avoiding unnecessary interventions in the 95% who clear naturally. The strategy is therefore consistent across both tables—stage‑based testing is the guiding principle, with CIN3 as the critical checkpoint for intervention.
Discussion
The CDC’s claim of 42 million infections and 13 million new annual cases conflates transient viral DNA detection with persistent oncogenic disease. The biological progression framework demonstrates that only a small minority of infections persist long enough to matter clinically. If the CDC’s figures represented persistent disease, cervical cancer incidence would be orders of magnitude higher than observed. Instead, SEER data confirm declining incidence and mortality, driven by natural clearance and screening.
The HPV Vaccines Biological Impossibilities (HVBI) Framework (HVBI Framework) clarifies that infection counts are rhetorical inflation. Just as PCR detection of rhinoviruses or coronaviruses does not justify mass vaccination against the common cold, detection of transient HPV DNA does not justify fear‑based vaccine mandates. The analogy underscores the pseudoscientific nature of conflating viral presence with inevitable pathology.
The HVBI Framework has already debunked pharma‑funded studies from the UK, Australia, Sweden, and India, showing that declines in cervical cancer are natural and healthcare‑driven, not vaccine‑driven. More debunked bogus studies are in pipeline.
Conclusion
The CDC’s assertion of 42 million current HPV infections and 13 million new annual infections is not only misleading but scientifically indefensible when examined against the natural history of HPV, stage‑specific progression data, and decades of epidemiological evidence. More than 95% of HPV infections clear spontaneously within two years, even for high‑risk oncogenic strains such as HPV‑16 and HPV‑18. Only a small minority persist long enough to progress through the multi‑decade sequence of CIN3, AIS, and invasive cancer. If the CDC’s figures truly represented persistent oncogenic disease, the United States would be experiencing hundreds of thousands of cervical cancer cases annually. Instead, SEER data confirm that incidence has declined by more than 50% since the mid‑1970s, and mortality has dropped to 2.2 per 100,000 women in 2022. These declines occurred despite population growth and before HPV vaccination was introduced, driven overwhelmingly by natural immunity, Pap screening, and treatment of precancers.
The conclusion is therefore unavoidable: the CDC’s backlog narrative is a rhetorical inflation that conflates transient viral DNA detection with inevitable pathology. It is biologically impossible for 42 million persistent infections and 13 million new persistent cases per year to exist without catastrophic cancer rates, which are not observed. The HVBI Framework demonstrates that infection counts must be contextualized within clearance kinetics and stage‑specific timelines, which show that only CIN3 represents the decisive intervention point. Policy built on inflated infection numbers risks fear‑based messaging and unnecessary medical interventions, rather than evidence‑based prevention. Transparent communication of clearance rates, the effectiveness of screening, and the limited proportion of infections that persist is the only scientifically valid approach. In light of the data, the CDC’s claims are not just exaggerated—they are unscientific presumptions that collapse under scrutiny, leaving no room for rebuttal.